In the modern digital landscape, performance testing plays a vital role in ensuring the reliability, speed, and stability of software applications. Whether it’s a high-traffic eCommerce platform, a banking app, or a B2B SaaS solution, users expect seamless performance. Even a few seconds of delay can lead to poor user experience, lost revenue, and negative brand perception.
To conduct effective performance testing, it’s crucial to understand what metrics to track and measure. The right metrics offer insights into how an application behaves under varying loads, helping you identify bottlenecks before they affect users in the real world.
In this blog, we will dive into the key performance testing metrics, their significance, and how modern performance testing tools and DevOps monitoring tools support this process.
What Is Performance Testing?
Performance testing is a type of software testing that evaluates how a system performs under various workloads. It helps determine the responsiveness, stability, scalability, and speed of an application. Unlike functional testing, which checks what the system does, performance testing measures how well it does it.
Some common types of performance testing include:
- Load testing
- Stress testing
- Spike testing
- Endurance testing
- Scalability testing
Why Metrics Matter in Performance Testing
Metrics are the foundation of performance testing. They provide quantifiable data to evaluate the system’s behavior and performance under stress. Without metrics, it’s impossible to determine whether an application meets performance benchmarks or SLAs (Service Level Agreements).
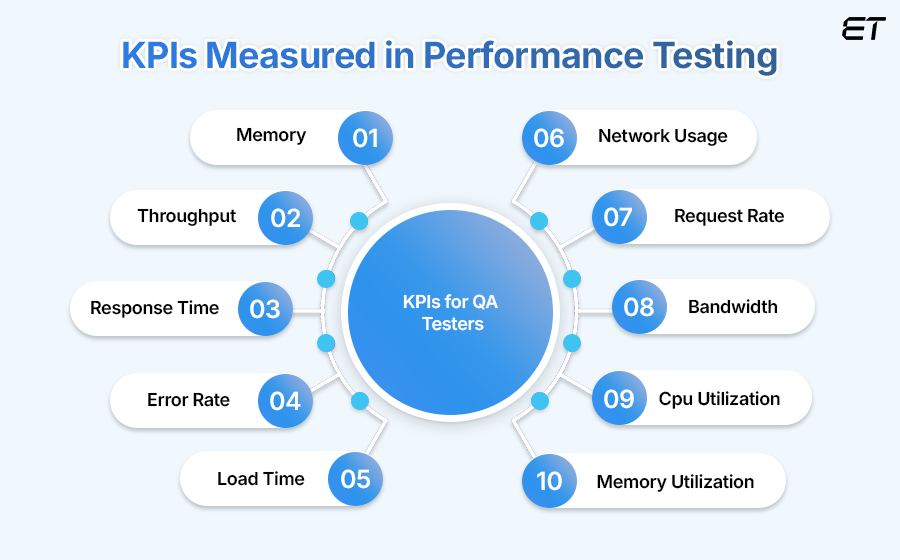
Let’s now explore the most important metrics you should measure during performance testing.
1. Response Time
Definition: The time taken by the application to respond to a user request.
Why it matters: This is one of the most critical metrics. A high response time can lead to poor user satisfaction and abandonment. For example, if a user clicks on “Buy Now” and it takes 5 seconds to load the payment page, that’s too long.
Ideal benchmark: Less than 2 seconds for web applications (but this varies by industry).
2. Throughput
Definition: The number of requests processed by the application per unit of time, often measured in transactions per second (TPS).
Why it matters: It shows how much load the system can handle efficiently. A higher throughput usually indicates a robust system.
Tip: Use a performance testing tool like Apache JMeter or Gatling to simulate concurrent users and measure throughput effectively.
3. Concurrent Users / Load
Definition: The number of users accessing the system simultaneously.
Why it matters: Testing concurrent users helps determine how the system behaves during peak traffic times. For example, an online ticket booking system must remain functional during a big release, despite thousands of simultaneous users.
Best practice: Perform load testing regularly, especially after updates.
4. Error Rate
Definition: The percentage of failed requests out of the total requests made.
Why it matters: A high error rate may indicate problems with the backend systems, APIs, or databases. It’s a strong signal that the system is struggling to handle the load.
Goal: Maintain an error rate below 1% during peak usage.
5. CPU and Memory Utilization
Definition: Measures how much CPU and memory resources the application consumes during the test.
Why it matters: High CPU or memory usage may lead to crashes or degraded performance. These metrics are also helpful in understanding resource bottlenecks and optimizing infrastructure.
Tool tip: Many DevOps monitoring tools like New Relic, Datadog, and Grafana integrate seamlessly with performance testing suites to visualize these metrics in real time.
6. Latency
Definition: The delay between the request sent by a user and the start of the response.
Why it matters: Latency is especially important in real-time applications like video streaming or gaming. Low latency ensures a smooth user experience.
Ideal benchmark: Should be below 100 milliseconds for real-time systems.
7. Peak Response Time
Definition: The longest time taken for a request to be processed during the test.
Why it matters: While average response time is important, peak response time helps identify worst-case scenarios and performance spikes that might affect users.
Use case: Detecting slow-performing transactions under stress.
8. Network Bandwidth and Throughput
Definition: Measures how much data is transferred over the network during testing.
Why it matters: Insufficient bandwidth or high network usage can impact performance, especially for applications relying heavily on media or large datasets.
Best practice: Monitor using network-specific DevOps tools to avoid false positives in test results.
9. Database Performance
Definition: Tracks the performance of queries, transactions, and database response times.
Why it matters: The database often becomes a bottleneck under heavy load. Long-running queries or locked tables can crash the application.
Monitoring tip: Use performance testing tools that provide insights into backend performance, or integrate them with APM tools.
10. Scalability
Definition: Measures how well the application can scale as the number of users increases.
Why it matters: As your business grows, your systems must grow with it. A scalable system ensures consistent performance during peak times and helps manage cloud resources efficiently.
Tool recommendation: Modern performance testing tools often come with auto-scaling test capabilities to simulate increasing loads.
Bringing It All Together with Tools
To collect and analyze these metrics effectively, a combination of performance testing tools and DevOps monitoring tools is essential.
- Performance Testing Tools: Apache JMeter, Gatling, LoadRunner, k6
These tools simulate real-world user load and capture core performance metrics like response time, throughput, and error rate. - DevOps Monitoring Tools: Prometheus, Grafana, New Relic, Datadog
These tools allow teams to continuously monitor system metrics like CPU usage, memory, and network performance before, during, and after performance tests.
The integration of these tools allows for real-time visibility, early detection, and faster root-cause analysis, making it easier to deliver high-performing, resilient applications.
Conclusion
Performance testing is more than just running scripts and simulating user traffic. It’s about measuring the right metrics to ensure your application meets performance standards, delivers a great user experience, and scales with your business.
By monitoring key metrics like response time, error rate, throughput, and resource utilization, and leveraging both performance testing tools and DevOps monitoring tools, teams can proactively identify bottlenecks, optimize performance, and reduce downtime risks.
In a world where every second matters, understanding these metrics is not just beneficial—it’s critical.